
|
Street Class Unlimited Class
DOHC SOHC Ion Updated 1/05 For the most recent list of the fastest five cars click here. |
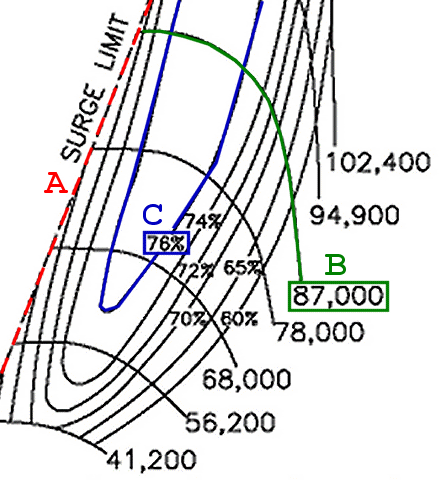
Deciphering Compressor Mapsby: TitanDeciding on a turbo for your car can be a difficult task. There are many different sizes to choose from and picking the wrong size will lead to poor performance. I will eliminate many of the variables by focusing on Saturn's 1.9 liter engine. We all know that the amount of fuel and air you can push through your engine is directly proportional to the amount of power it will make. Unfortunately, Saturn's 1.9 liter engine is only 116 cubic inches, 1/3 that of a Chevy 350 engine, which gives this engine a large disadvantage when it comes to making power purely by the displacement. The old saying, "there is no substitute for cubic inches" holds true until you add forced induction. Turbo's can substantially increase the power level of any vehicle by compressing a large volume of air into a smaller space. This increased volume effectively "over fills" the cylinders making the small 4-cylinder engine behave like a larger 8-cylinder engine. Unfortunately, you just can't bolt on the largest turbo you can find and expect huge amounts of power, compromises must be made when deciding on the proper turbo charger. If you choose too large of a turbo then drivability will suffer, while a turbo that is too small will not be able to produce enough power at higher rpms. To properly choose a turbo you must match the turbo's capabilities with your engine's characteristics, which can be done using a turbine compressor map. Turbine compressor maps contain vital information for choosing the proper turbo size. They display information based on the amount of airflow produced by the turbo at a certain pressure. Although, turbine compressor maps are not the easiest diagrams to read deciphering these cryptic maps can be easily accomplished with some additional engine information. But first, we need to familiarize ourselves with the general features and terminology of a basic compressor map. Turbo housing compressor maps are traditionally plotted on an x-y axis. This allows you to view your engine's airflow requirement (x-axis) vs. the amount of airflow produced by the turbo (y-axis). This x-y relationship will determine the turbo's efficiency range. The key to finding the turbo that suits your application is to make sure that the engine's airflow requirements (x-axis) and turbo flow rate (y-axis) intersect at an efficiency value no less than 60%. This will insure that you have the widest range of performance with your turbo. Below is a section of a compressor map that has been enlarged to show better detail. There are three letters associated with the map (A, B, and C), which represent the surge limit, turbine rpm, and turbo efficiency regions respectively. The surge limit (A) is represented by the red dotted line located on the left-hand side of the efficiency curve. The area to the left of the surge limit is characterized by airflow reversal and unstable operation. Never choose turbo whose compressor map places the operating range to the left of the surge limit line or turbo failure will result. Turbine rpm (B) is boxed in green and the green line represents that rpm through the efficiency curves. The blue outlined region (C) shows the area where the turbo is at 72% efficiency. So, any time the turbo is within this area of the map it will be at 72% efficiency. Several other efficiency areas surround the one outlined in blue. If any of your intersected points fall into those areas they will be at those respected efficiency values. If your intersected point lies too far to the right of the efficiency curve you will be forcing the turbo to exceed the maximum recommended rpms. Surpassing the efficiency range (going off the chart) to the right will generate an enormous amount of heat and lead to oil choking. Choking is when the turbo gets so hot that oil turns into hard carbon deposits inside the turbo housing. This choked oil quickly induces premature wear of the shaft turbine shaft and bearings. With the fundamentals covered, we need to determine engine airflow requirements and boost pressure ratio. These data will allow us to plot points on the compressor map. Skip to page 2, 3 |
|


